
»

»

Georgia Street Reconstruction Progress Brings Temporary Traffic Adjustments

Georgia Street Reconstruction Progress Brings Temporary Traffic Adjustments

Published on

Email
Print

As development continues along South Georgia Street, the City of Amarillo is continuing reconstruction efforts designed to increase roadway capacity and improve drainage along the corridor.

The Georgia Street Reconstruction Project expands Georgia Street from Hollywood Road to Burk Lane, approximately 1.5 miles. The project includes pavement widening, drainage improvements and utility relocations. Construction began in May 2025 and is scheduled for completion in November 2028.

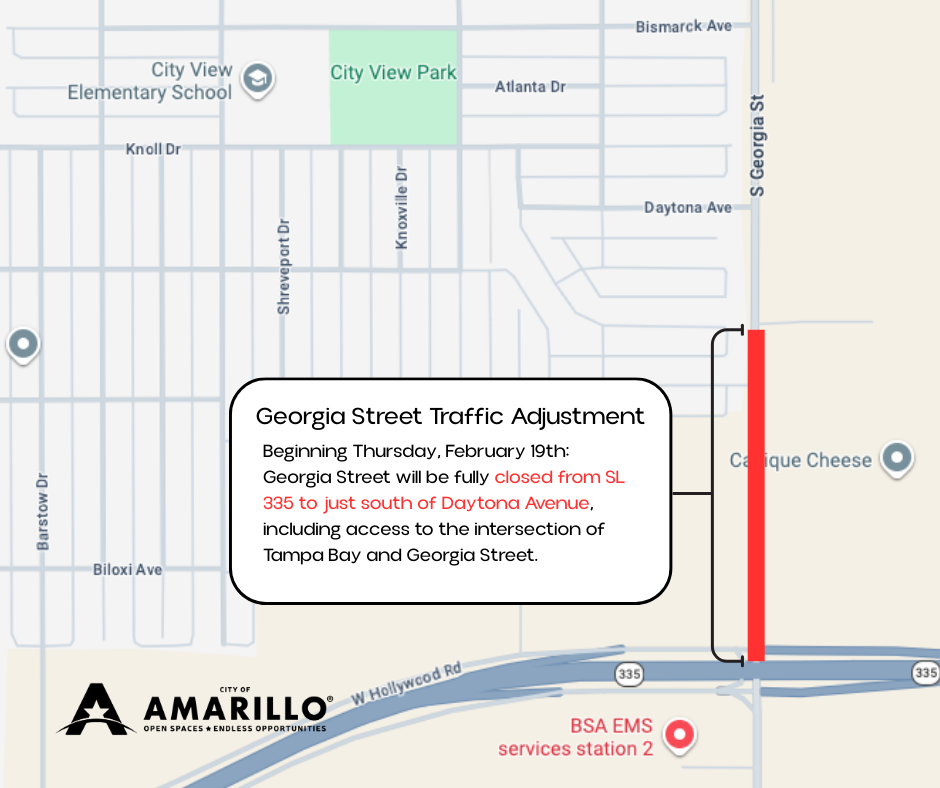
Traffic patterns on Georgia Street will be temporarily adjusted beginning Thursday, February 19.

Georgia Street will be fully closed from SL 335 to just south of Daytona Avenue, including access to the intersection of Tampa Bay and Georgia Street. The full closure is necessary to allow crews to safely set up and complete concrete paving operations. This phase requires the use of large machinery that must operate continuously to ensure a smooth, durable roadway surface. Completing this work all at one time is the most efficient method and will help reduce the overall construction timeline and future disruptions.

Local southbound traffic on Georgia Street will continue to have access to Nashville Avenue, Bismarck Avenue and Daytona Avenue, with limited access to Augustus Drive.

Southbound through traffic will detour at Farmers Avenue to Western Street, then to SL 335 and back to Georgia Street. Northbound traffic will detour at SL 335 to Western Street, then to Farmers Avenue and back to Georgia Street. Detour signage will be posted in advance.

The adjusted traffic pattern is expected to remain in place through May 31, 2026.

The reconstruction project is intended to support continued growth in the area while improving traffic flow and drainage capacity along the corridor.

Motorists are encouraged to follow posted signage and use caution when traveling near the work zone.
Select A Language to Translate This Page

About Translations on Amarillo.gov

The City of Amarillo offers translations of content on Amarillo.gov through the Google Translate web translator (translate.google.com). Because Google Translate is an external service, the City does not control the quality or accuracy of translated content. As a result, some translations may contain inaccuracies, and there may be issues with the appearance of translated pages, including errors in images.

If you encounter incorrect or substandard translations, you can help improve them by contributing better translations using Google Translate:

  1. Hover over any text containing an error, and a pop-up box will appear.
  2. Click “Contribute a better translation.”
  3. Double-click the area of the pop-up that says “Click a word for alternative translations, or double-click to edit directly.”
  4. Make your edits directly in the text box.
  5. Press “Contribute” to submit your suggested changes.

For more information on contributing to Google Translate, visit Google Translate’s help page.

Please note that the City of Amarillo does not control the process by which contributed translations are incorporated into Google Translate.

The City of Amarillo is dedicated to enhancing the accessibility and multilingual content available on our website.

City of Amarillo: Property Taxes Rebated Per Year by Agreement Type 

Overview 

The chart shows the dollar amounts of property taxes rebated per year over the last five fiscal years, broken down by agreement type. There were no Chapter 380 property tax rebates in the first two years listed. The total amount increased slightly each year, with a more significant increase in the most recent year. 

Values 

Numerical values presented on the image: 


Fiscal Year 2020/2021 

Fiscal Year 2021/2022 

Fiscal Year 2022/2023 

Fiscal Year 2023/2024 

Fiscal Year 2024/2025 

Chapter 311 

$533,080 

$547,426 

$574,947 

$591,249 

$821,350 

Chapter 380 

$0 

$0 

$37,387 

$39,172 

$61,013 

Presentation 

The bar chart shows the amount of property taxes rebated in the past five fiscal years, broken down by agreement type. The horizontal axis shows each of the past five fiscal years and the vertical axis shows the dollar amount rebated. For each fiscal year there is vertical column, comprised of two stacked columns, each of which representing the different agreement types. 

City of Amarillo: Number of Tax Abatements Granted Per Year 

Overview 

The chart shows the number of businesses that received a tax abatement from the City of Amarillo in the past five fiscal years. The 2020/21 and 2021/22 fiscal years each had four active abatements, 2022/23 had five, and 2023/24 and 2024/25 each had seven. 

Values 

Numerical values presented on the image: 


Fiscal Year 2020/2021 

Fiscal Year 2021/2022 

Fiscal Year 2022/2023 

Fiscal Year 2023/2024 

Fiscal Year 2024/2025 

Active Abatements Per Year 

4 

4 

5 

7 

7 

Presentation 

The bar chart shows the number of businesses that received a tax abatement from the City of Amarillo in the past five fiscal years. The horizontal axis shows each of the past five fiscal years and the vertical axis shows the number of active abatements each year. Each year has one column, with the height indicating number of active abatements in that year.

Amount of Taxes Abated Per Year 

Overview 

The chart shows the dollar amounts abated over the past five fiscal years from Chapter 312 tax abatement agreements. Each fiscal year shows a larger dollar amount abated, with minor growth over the first three years, a higher increase in the fourth year, and minor growth again in the fifth year. 

Values 

Numerical values presented on the image: 


Fiscal Year 2020/2021 

Fiscal Year 2021/2022 

Fiscal Year 2022/2023 

Fiscal Year 2023/2024 

Fiscal Year 2024/2025 

Taxes Abated by City of Amarillo 

$510,061 

$623,017 

$679,849 

$965,261 

$1,143,899 

Total Abated by All Entities Including City of Amarillo 

$1,569,512 

$1,926,332 

$2,103,099 

$2,884,936 

$2,959,496 

Presentation 

The bar chart represents the amount of taxes abated over the past five fiscal years. The horizontal axis shows each of the past five fiscal years and the vertical axis shows the dollar amount abated. The bar representing taxes abated by the City of Amarillo is sightly offset to the side of the bar representing the amount abated by all participating tax entities for each fiscal year. This shows that the amount abated by the City of Amarillo is a part of the total amount abated by all entities.

City of Amarillo: Taxes Rebated Per Year by Type 

Overview 

This chart shows the dollar amounts rebated by the City of Amarillo from economic development incentive agreements over the past five fiscal years. Each year is broken down by rebate type, including property tax rebates, hotel occupancy tax rebates, and sales tax rebates. Each fiscal year shows a slight increase in total dollars rebated, with a more drastic increase in the most recent fiscal year. 

Values 

Numerical values presented on the image: 


Fiscal Year 2020/2021 

Fiscal Year 2021/2022 

Fiscal Year 2022/2023 

Fiscal Year 2023/2024 

Fiscal Year 2024/2025 

Property Tax Rebates 

$533,080 

$547,426 

$612,334 

$630,421 

$882,363 

Hotel Occupancy Tax Rebates 

$686,747 

$753,112 

$794,828 

$871,423 

$808,348 

Sales Tax Rebates 

$0 

$21,046 

$55,528 

$45,881 

$368,716 


Presentation 

The bar chart represents the amount rebated by the City of Amarillo for each type of tax rebate over the past five fiscal years. The horizontal axis shows each of the past five fiscal years and the vertical axis shows the dollar amount rebated. The different rebate types are stacked vertically in each fiscal year, with the height representing the total dollar amount rebated.