
The Amarillo MPO collaborates with local, county, and state officials to coordinate and develop transportation systems, ensuring effective planning, coordination of transportation modes, and proposing projects that meet the region’s transportation needs.

MPO Card Image

The Amarillo MPO was established in 1973 to coordinate transportation planning for the Amarillo metropolitan area. The MPO ensures that federal transportation funds are allocated to projects that meet local needs and are part of a comprehensive, continuous, and cooperative planning process.

Study Area

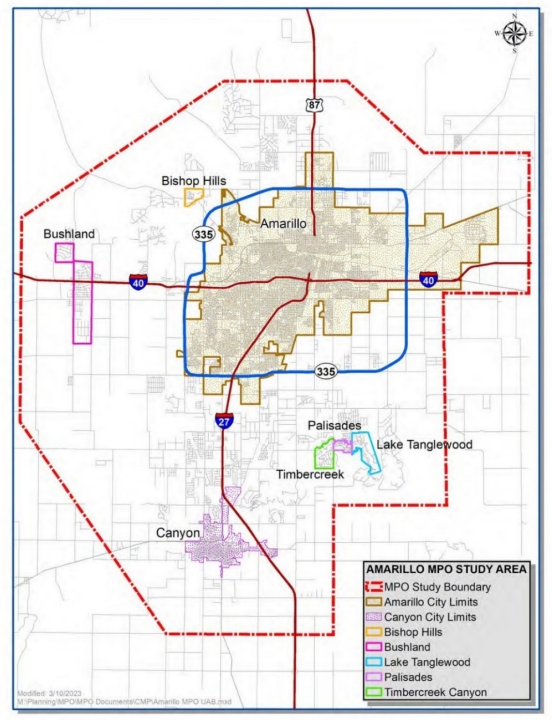
The MPO’s study area, known as the Metropolitan Area Boundary (MAB), includes Amarillo, Canyon, Bushland, Lake Tanglewood, Timber Creek Canyon, Palisades, and Bishop Hills.

About Amarillo Area MPO

Introduction

The Amarillo Metropolitan Planning Organization (MPO) coordinates transportation planning for the Amarillo area, ensuring that local and regional systems are developed in alignment with federal and state standards. The MPO is responsible for planning and coordinating transportation systems, developing and maintaining transportation improvement programs, and engaging the public in the planning process.

Key Responsibilities:

  • Plan and coordinate transportation systems
  • Develop and maintain transportation improvement programs
  • Engage public participation in transportation planning 

The MPO’s jurisdiction covers the Amarillo Metropolitan Area Boundary, which includes Amarillo, Canyon, Bushland, and several surrounding communities.
  • Carrying out the Metropolitan Transportation Plan (MTP): We’re actively implementing projects to improve transportation based on the MTP.
  • Developing Intermodal Connections: Our focus is on creating better links between various transportation modes (e.g., buses, bikes, cars).
  • Engaging the Public: We invite public participation in all planning processes to ensure that transportation solutions meet community needs.
  • Highway & Bridge Projects: We use federal funding from programs like the Surface Transportation Program (STP) and the National Highway System (NHS) to fund major transportation projects.
  • Transit Projects: Transit improvements are supported through various federal and state programs for both urban and rural areas.

The public can attend MPO Policy Committee meetings, participate in public forums, and share feedback through surveys. We encourage community involvement to ensure transportation planning meets local needs.

The Amarillo MPO office is located at: 808 S Buchanan St, 2nd Floor, Simms Municipal Building, Amarillo, TX Office Hours: Monday – Friday, 8:00 am – 5:00 pm (Closed on holidays)

Sign Up For the Amarillo MPO Email List


Select A Language to Translate This Page

About Translations on Amarillo.gov

The City of Amarillo offers translations of content on Amarillo.gov through the Google Translate web translator (translate.google.com). Because Google Translate is an external service, the City does not control the quality or accuracy of translated content. As a result, some translations may contain inaccuracies, and there may be issues with the appearance of translated pages, including errors in images.

If you encounter incorrect or substandard translations, you can help improve them by contributing better translations using Google Translate:

  1. Hover over any text containing an error, and a pop-up box will appear.
  2. Click “Contribute a better translation.”
  3. Double-click the area of the pop-up that says “Click a word for alternative translations, or double-click to edit directly.”
  4. Make your edits directly in the text box.
  5. Press “Contribute” to submit your suggested changes.

For more information on contributing to Google Translate, visit Google Translate’s help page.

Please note that the City of Amarillo does not control the process by which contributed translations are incorporated into Google Translate.

The City of Amarillo is dedicated to enhancing the accessibility and multilingual content available on our website.

City of Amarillo: Property Taxes Rebated Per Year by Agreement Type 

Overview 

The chart shows the dollar amounts of property taxes rebated per year over the last five fiscal years, broken down by agreement type. There were no Chapter 380 property tax rebates in the first two years listed. The total amount increased slightly each year, with a more significant increase in the most recent year. 

Values 

Numerical values presented on the image: 


Fiscal Year 2020/2021 

Fiscal Year 2021/2022 

Fiscal Year 2022/2023 

Fiscal Year 2023/2024 

Fiscal Year 2024/2025 

Chapter 311 

$533,080 

$547,426 

$574,947 

$591,249 

$821,350 

Chapter 380 

$0 

$0 

$37,387 

$39,172 

$61,013 

Presentation 

The bar chart shows the amount of property taxes rebated in the past five fiscal years, broken down by agreement type. The horizontal axis shows each of the past five fiscal years and the vertical axis shows the dollar amount rebated. For each fiscal year there is vertical column, comprised of two stacked columns, each of which representing the different agreement types. 

City of Amarillo: Number of Tax Abatements Granted Per Year 

Overview 

The chart shows the number of businesses that received a tax abatement from the City of Amarillo in the past five fiscal years. The 2020/21 and 2021/22 fiscal years each had four active abatements, 2022/23 had five, and 2023/24 and 2024/25 each had seven. 

Values 

Numerical values presented on the image: 


Fiscal Year 2020/2021 

Fiscal Year 2021/2022 

Fiscal Year 2022/2023 

Fiscal Year 2023/2024 

Fiscal Year 2024/2025 

Active Abatements Per Year 

4 

4 

5 

7 

7 

Presentation 

The bar chart shows the number of businesses that received a tax abatement from the City of Amarillo in the past five fiscal years. The horizontal axis shows each of the past five fiscal years and the vertical axis shows the number of active abatements each year. Each year has one column, with the height indicating number of active abatements in that year.

Amount of Taxes Abated Per Year 

Overview 

The chart shows the dollar amounts abated over the past five fiscal years from Chapter 312 tax abatement agreements. Each fiscal year shows a larger dollar amount abated, with minor growth over the first three years, a higher increase in the fourth year, and minor growth again in the fifth year. 

Values 

Numerical values presented on the image: 


Fiscal Year 2020/2021 

Fiscal Year 2021/2022 

Fiscal Year 2022/2023 

Fiscal Year 2023/2024 

Fiscal Year 2024/2025 

Taxes Abated by City of Amarillo 

$510,061 

$623,017 

$679,849 

$965,261 

$1,143,899 

Total Abated by All Entities Including City of Amarillo 

$1,569,512 

$1,926,332 

$2,103,099 

$2,884,936 

$2,959,496 

Presentation 

The bar chart represents the amount of taxes abated over the past five fiscal years. The horizontal axis shows each of the past five fiscal years and the vertical axis shows the dollar amount abated. The bar representing taxes abated by the City of Amarillo is sightly offset to the side of the bar representing the amount abated by all participating tax entities for each fiscal year. This shows that the amount abated by the City of Amarillo is a part of the total amount abated by all entities.

City of Amarillo: Taxes Rebated Per Year by Type 

Overview 

This chart shows the dollar amounts rebated by the City of Amarillo from economic development incentive agreements over the past five fiscal years. Each year is broken down by rebate type, including property tax rebates, hotel occupancy tax rebates, and sales tax rebates. Each fiscal year shows a slight increase in total dollars rebated, with a more drastic increase in the most recent fiscal year. 

Values 

Numerical values presented on the image: 


Fiscal Year 2020/2021 

Fiscal Year 2021/2022 

Fiscal Year 2022/2023 

Fiscal Year 2023/2024 

Fiscal Year 2024/2025 

Property Tax Rebates 

$533,080 

$547,426 

$612,334 

$630,421 

$882,363 

Hotel Occupancy Tax Rebates 

$686,747 

$753,112 

$794,828 

$871,423 

$808,348 

Sales Tax Rebates 

$0 

$21,046 

$55,528 

$45,881 

$368,716 


Presentation 

The bar chart represents the amount rebated by the City of Amarillo for each type of tax rebate over the past five fiscal years. The horizontal axis shows each of the past five fiscal years and the vertical axis shows the dollar amount rebated. The different rebate types are stacked vertically in each fiscal year, with the height representing the total dollar amount rebated.