
»

»

Talent Pool: Harrison Earns Elite Certification

Talent Pool: Harrison Earns Elite Certification

Published on

Email
Print

Madison Harrison has reached an elite level in her profession with the City of Amarillo (COA).

Think of it as similar to a black belt in the world of karate.

Or (not to be too nerdy) think of it as being a Jedi Master in the world of “Star Wars.”

“I guess that might be similar,” Harrison said with a laugh.

Harrison, an Environmental Health Specialist III with the COA Environmental Health Department, has earned the title of Certified Master Pool Builder.

For perspective, Harrison is one of 53 people in the world who have earned such certification. She is one of 50 in the United States, one of nine in Texas and the only COA employee.

“The certification that Madison has earned is a rare and unique accomplishment,” said COA Director of Environmental Health Anthony Spanel. “We are extremely proud of Madison.

“This sets Amarillo apart from all others as Madison has advanced knowledge of pool design and operation allowing her to aid the community in complex problem-solving related to recreational bodies of water. The goal is to have a direct impact on public health by reducing waterborne illnesses and unintentional drownings through educational and regulatory intervention.”

Harrison spent more than two years earning the certification from the Pool and Hot Tub Alliance. She completed 150 hours of education across four levels and traveled to Dallas, Atlantic City and Florida.

As part of her job, Harrison inspects all public and semi-public pools in Potter and Randall counties. This includes city pools, apartments, gyms, clubs, etc.

“I have not only gained a lot of experience and knowledge but also perspective,” said Harrison, who has been with the city for four years. “As an inspector, we learn what the codes say and why. We don’t really learn the technical or applicable side of things.

“I feel like I have a level of education now that I could meet architects, designers and engineers submitting plans to our office on their level. I can not only help them meet codes but also offer solutions that meet what they are trying to do as well.”

Inspections by the COA Environmental Health Department, including food inspections, are available online at: inspections.myhealthdepartment.com/aaphd

For information on the COA Environmental Health Department, go to:

www.amarillo.gov/environmental-health/
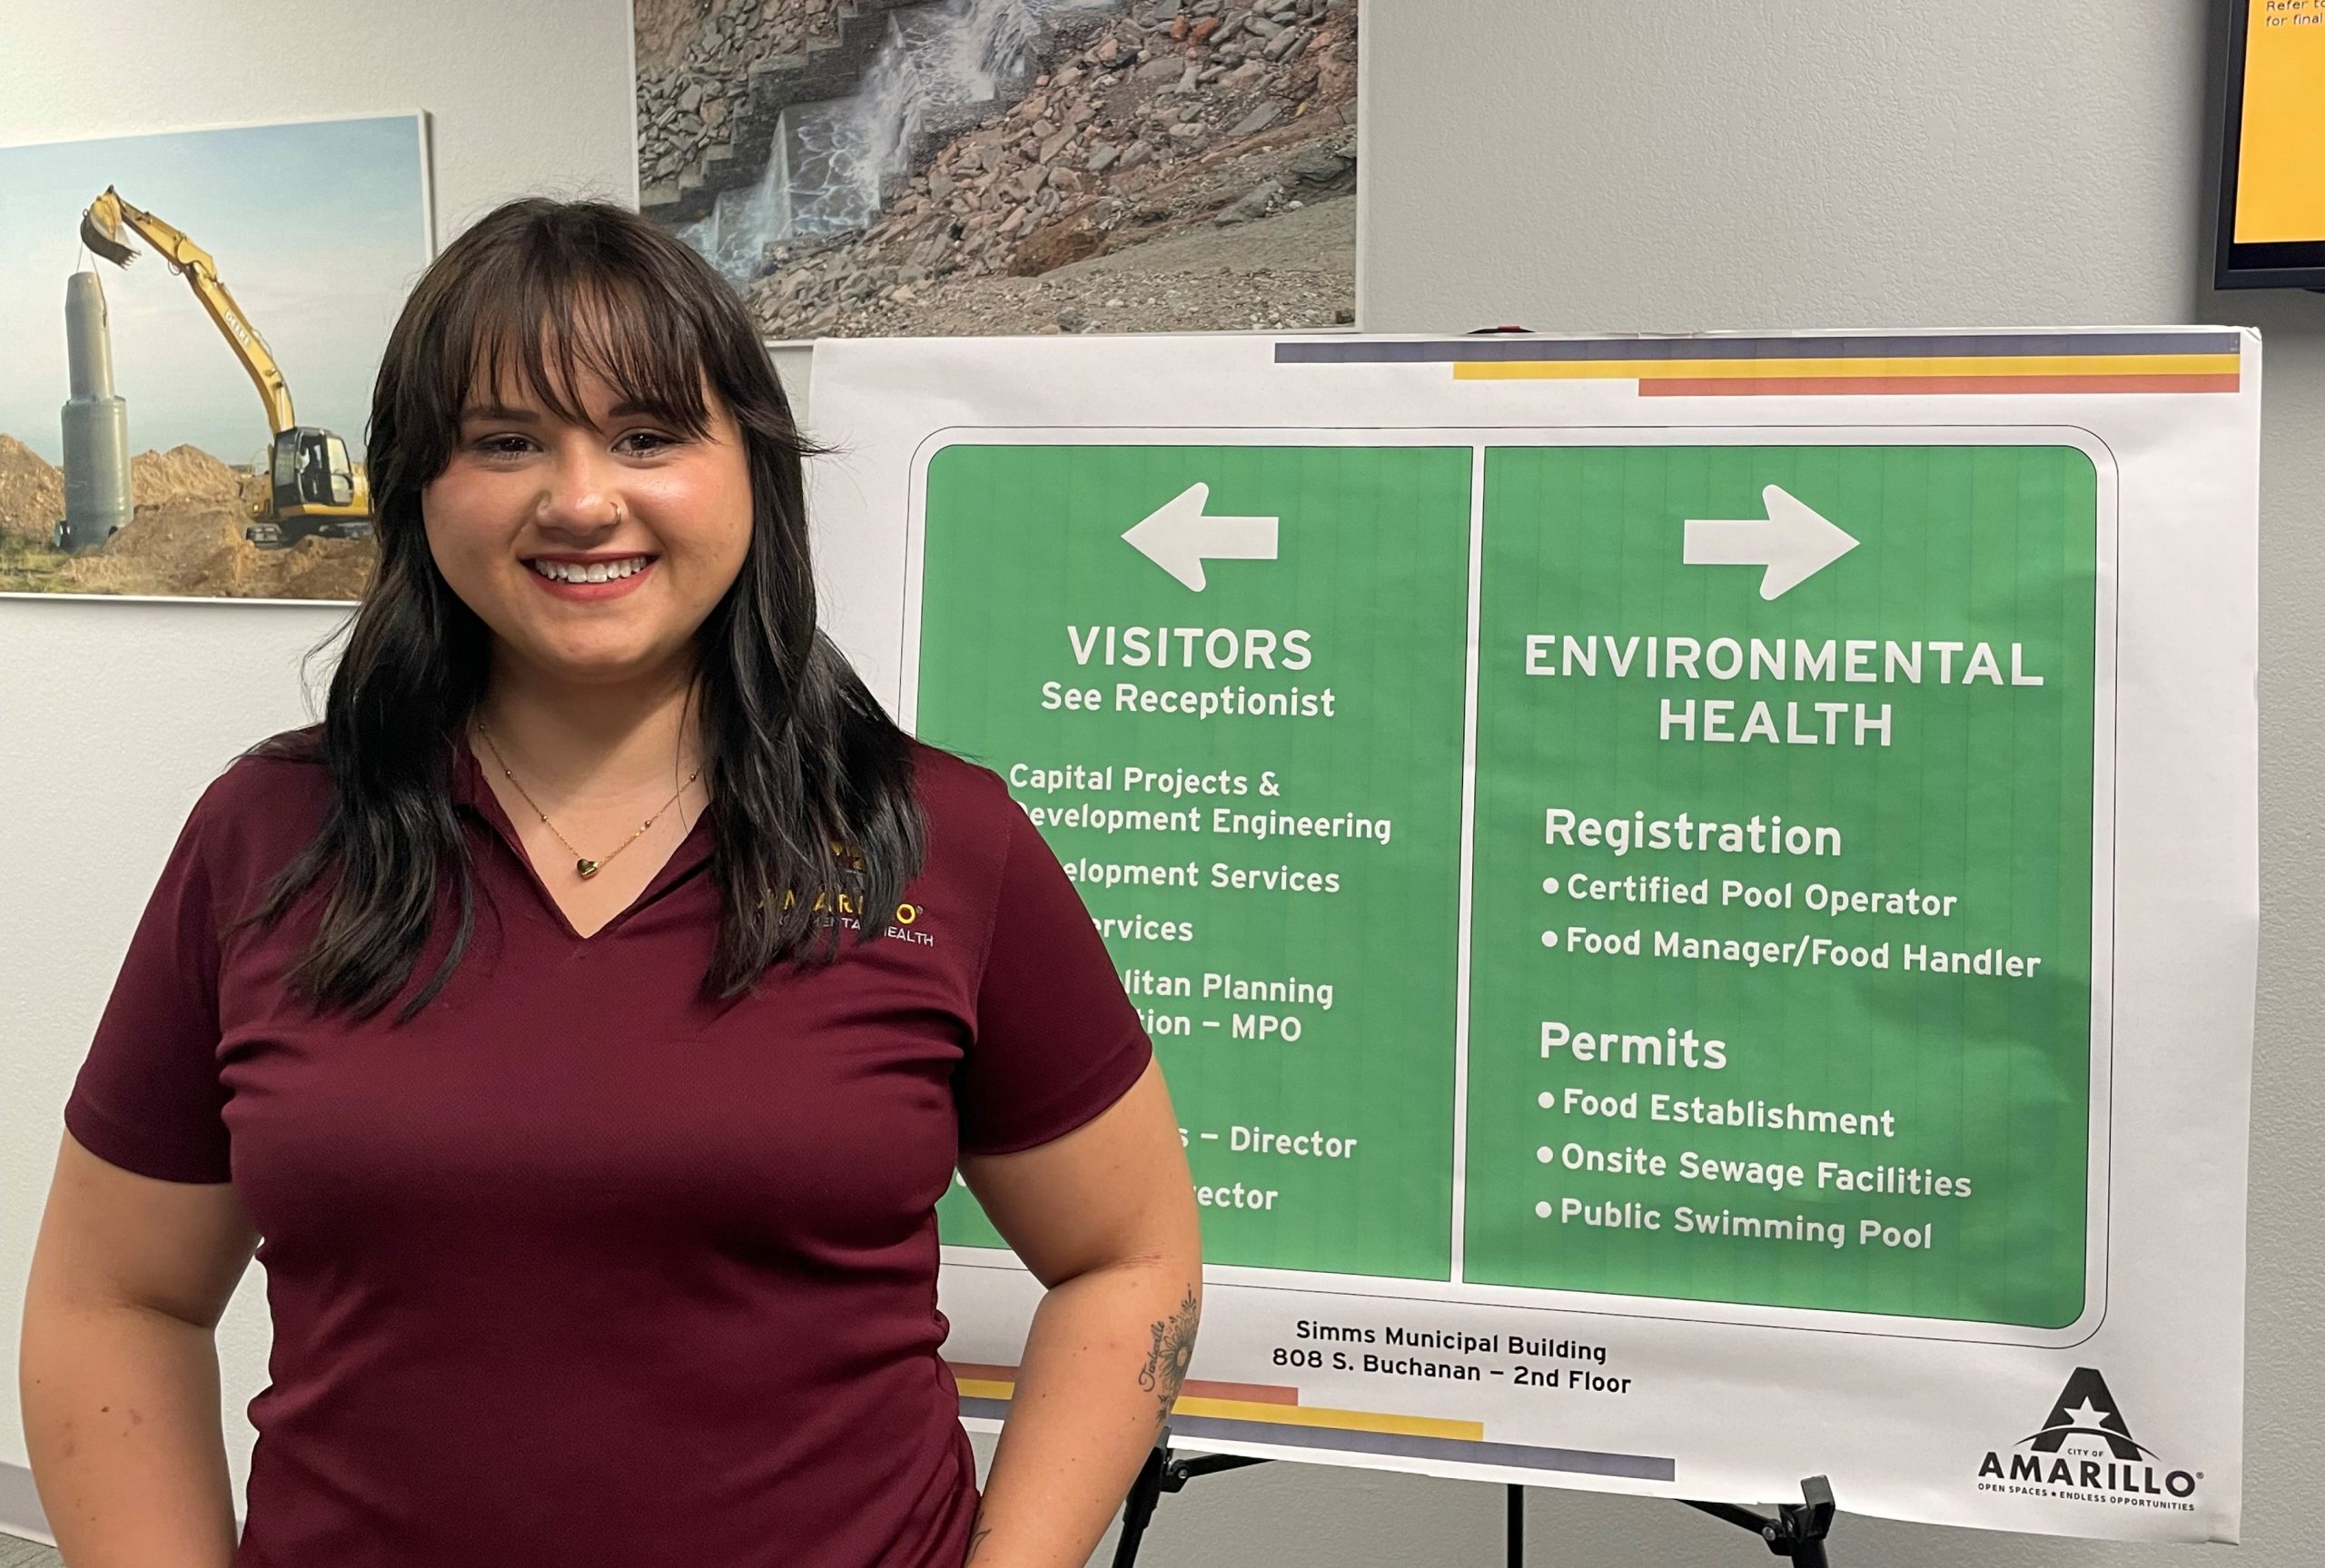
Madison Harrison Image - Pool Inspector with Environmental Health

Select A Language to Translate This Page

About Translations on Amarillo.gov

The City of Amarillo offers translations of content on Amarillo.gov through the Google Translate web translator (translate.google.com). Because Google Translate is an external service, the City does not control the quality or accuracy of translated content. As a result, some translations may contain inaccuracies, and there may be issues with the appearance of translated pages, including errors in images.

If you encounter incorrect or substandard translations, you can help improve them by contributing better translations using Google Translate:

  1. Hover over any text containing an error, and a pop-up box will appear.
  2. Click “Contribute a better translation.”
  3. Double-click the area of the pop-up that says “Click a word for alternative translations, or double-click to edit directly.”
  4. Make your edits directly in the text box.
  5. Press “Contribute” to submit your suggested changes.

For more information on contributing to Google Translate, visit Google Translate’s help page.

Please note that the City of Amarillo does not control the process by which contributed translations are incorporated into Google Translate.

The City of Amarillo is dedicated to enhancing the accessibility and multilingual content available on our website.

City of Amarillo: Property Taxes Rebated Per Year by Agreement Type 

Overview 

The chart shows the dollar amounts of property taxes rebated per year over the last five fiscal years, broken down by agreement type. There were no Chapter 380 property tax rebates in the first two years listed. The total amount increased slightly each year, with a more significant increase in the most recent year. 

Values 

Numerical values presented on the image: 


Fiscal Year 2020/2021 

Fiscal Year 2021/2022 

Fiscal Year 2022/2023 

Fiscal Year 2023/2024 

Fiscal Year 2024/2025 

Chapter 311 

$533,080 

$547,426 

$574,947 

$591,249 

$821,350 

Chapter 380 

$0 

$0 

$37,387 

$39,172 

$61,013 

Presentation 

The bar chart shows the amount of property taxes rebated in the past five fiscal years, broken down by agreement type. The horizontal axis shows each of the past five fiscal years and the vertical axis shows the dollar amount rebated. For each fiscal year there is vertical column, comprised of two stacked columns, each of which representing the different agreement types. 

City of Amarillo: Number of Tax Abatements Granted Per Year 

Overview 

The chart shows the number of businesses that received a tax abatement from the City of Amarillo in the past five fiscal years. The 2020/21 and 2021/22 fiscal years each had four active abatements, 2022/23 had five, and 2023/24 and 2024/25 each had seven. 

Values 

Numerical values presented on the image: 


Fiscal Year 2020/2021 

Fiscal Year 2021/2022 

Fiscal Year 2022/2023 

Fiscal Year 2023/2024 

Fiscal Year 2024/2025 

Active Abatements Per Year 

4 

4 

5 

7 

7 

Presentation 

The bar chart shows the number of businesses that received a tax abatement from the City of Amarillo in the past five fiscal years. The horizontal axis shows each of the past five fiscal years and the vertical axis shows the number of active abatements each year. Each year has one column, with the height indicating number of active abatements in that year.

Amount of Taxes Abated Per Year 

Overview 

The chart shows the dollar amounts abated over the past five fiscal years from Chapter 312 tax abatement agreements. Each fiscal year shows a larger dollar amount abated, with minor growth over the first three years, a higher increase in the fourth year, and minor growth again in the fifth year. 

Values 

Numerical values presented on the image: 


Fiscal Year 2020/2021 

Fiscal Year 2021/2022 

Fiscal Year 2022/2023 

Fiscal Year 2023/2024 

Fiscal Year 2024/2025 

Taxes Abated by City of Amarillo 

$510,061 

$623,017 

$679,849 

$965,261 

$1,143,899 

Total Abated by All Entities Including City of Amarillo 

$1,569,512 

$1,926,332 

$2,103,099 

$2,884,936 

$2,959,496 

Presentation 

The bar chart represents the amount of taxes abated over the past five fiscal years. The horizontal axis shows each of the past five fiscal years and the vertical axis shows the dollar amount abated. The bar representing taxes abated by the City of Amarillo is sightly offset to the side of the bar representing the amount abated by all participating tax entities for each fiscal year. This shows that the amount abated by the City of Amarillo is a part of the total amount abated by all entities.

City of Amarillo: Taxes Rebated Per Year by Type 

Overview 

This chart shows the dollar amounts rebated by the City of Amarillo from economic development incentive agreements over the past five fiscal years. Each year is broken down by rebate type, including property tax rebates, hotel occupancy tax rebates, and sales tax rebates. Each fiscal year shows a slight increase in total dollars rebated, with a more drastic increase in the most recent fiscal year. 

Values 

Numerical values presented on the image: 


Fiscal Year 2020/2021 

Fiscal Year 2021/2022 

Fiscal Year 2022/2023 

Fiscal Year 2023/2024 

Fiscal Year 2024/2025 

Property Tax Rebates 

$533,080 

$547,426 

$612,334 

$630,421 

$882,363 

Hotel Occupancy Tax Rebates 

$686,747 

$753,112 

$794,828 

$871,423 

$808,348 

Sales Tax Rebates 

$0 

$21,046 

$55,528 

$45,881 

$368,716 


Presentation 

The bar chart represents the amount rebated by the City of Amarillo for each type of tax rebate over the past five fiscal years. The horizontal axis shows each of the past five fiscal years and the vertical axis shows the dollar amount rebated. The different rebate types are stacked vertically in each fiscal year, with the height representing the total dollar amount rebated.