NEZ Incentive Program Details

The Neighborhood Empowerment Zone program is designed to improve neighborhood conditions by encouraging private investment in housing, businesses, and services in the neighborhood plan areas. Authorized by Chapter 378 of the Texas Local Government Code, the NEZ program makes incentives such as building permit fee waivers, sales tax rebates, and municipal property tax abatements available to homeowners, investor-owners, and developers proposing new construction or rehabilitation in designated zones.

How Does It Work? 
  • Identify your construction or rehabilitation project. See the sample case studies for examples and review the eligibility list in the helpful links section. Projects must meet the goals of the respective neighborhood plans, and the Development Guidelines established for each zone.
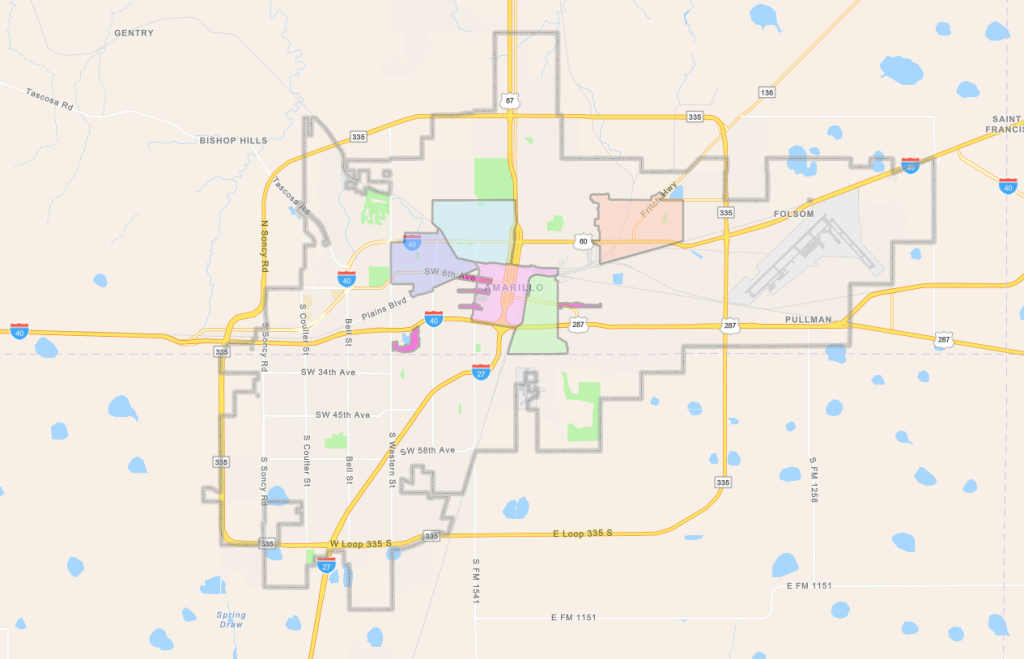
  • Verify that the project is located within one of five Neighborhood Empowerment Zones. Note, in Downtown, the program is limited to fee waivers for residential projects. Use the map to check the address location.
  • Complete the application and submit to the Assistant Director of Planning, Drew Brassfield.
  • Planning staff will then review complete applications to ensure the project meets the requirements of the program. Approved projects will receive NEZ Certification. This immediately qualifies the project for development fee waivers and the other departments will be notified. If applying for permit fee waivers only, you will not pay anything at the time of permitting.
  • Projects that invest 20% or more of the PRAD Improvements Value are then eligible to receive a property tax abatement on the increase in value or a sales tax rebate. Both of these incentives are required to be approved by City Council which will require an additional 4-6 weeks.
Where are the Neighborhood Empowerment Zones located?
  • North Heights
  • Barrio
  • San Jacinto
  • Eastridge
  • Downtown*  (residential only, fee waivers only)
  • Commercial Corridors
 
To view boundaries, select the Neighborhood Empowerment Zones layer: Economic Development Map
 

Neighborhood Empowerment Zone FAQs

There are three types of incentives available:

  • Development Fee Waivers
  • Municipal Property Tax Abatement* (5 or 10-year agreements)
  • Sales Tax Rebates*  (.5%, 5-year agreements)  

*Projects are required to invest at least 20% of the PRAD Improvements Value.

  • Owner-Occupied Single-Family: Includes rehabilitation or new construction for single-family homes.
  • Investor-Owned Single-Family: Includes rehabilitation or new construction for single-family homes.
  • Multi-Lot Single-Family: New construction projects for owner-occupied single-family homes.
  • Duplex, Townhome, and Condominium: Rehabilitation or new construction for properties that are owner or renter-occupied.
  • Multi-Family Apartments: Rehabilitation or new construction for apartment buildings with 3 or more units.
  • Mixed-Use Projects: Rehabilitation or new construction for projects combining residential and commercial uses.
  • Non-Residential Projects: Rehabilitation or new construction for neighborhood services, retail, office, institutional, and light commercial uses, adhering to development guidelines and neighborhood plans.
  • Note: Tax rebates may be available through a Chapter 380 agreement.

There is no fee to apply for the Neighborhood Empowerment Zone Incentive Program. 

You are not required to participate. If you are applying for permits for the project, you’ll be asked to sign an acknowledgment that you are aware of the program and choose not to apply.

Assistant Director of Planning, Drew Brassfield 806-378-5241 or drew.brassfield@amarillo.gov

Select A Language to Translate This Page

About Translations on Amarillo.gov

The City of Amarillo offers translations of content on Amarillo.gov through the Google Translate web translator (translate.google.com). Because Google Translate is an external service, the City does not control the quality or accuracy of translated content. As a result, some translations may contain inaccuracies, and there may be issues with the appearance of translated pages, including errors in images.

If you encounter incorrect or substandard translations, you can help improve them by contributing better translations using Google Translate:

  1. Hover over any text containing an error, and a pop-up box will appear.
  2. Click “Contribute a better translation.”
  3. Double-click the area of the pop-up that says “Click a word for alternative translations, or double-click to edit directly.”
  4. Make your edits directly in the text box.
  5. Press “Contribute” to submit your suggested changes.

For more information on contributing to Google Translate, visit Google Translate’s help page.

Please note that the City of Amarillo does not control the process by which contributed translations are incorporated into Google Translate.

The City of Amarillo is dedicated to enhancing the accessibility and multilingual content available on our website.

City of Amarillo: Property Taxes Rebated Per Year by Agreement Type 

Overview 

The chart shows the dollar amounts of property taxes rebated per year over the last five fiscal years, broken down by agreement type. There were no Chapter 380 property tax rebates in the first two years listed. The total amount increased slightly each year, with a more significant increase in the most recent year. 

Values 

Numerical values presented on the image: 


Fiscal Year 2020/2021 

Fiscal Year 2021/2022 

Fiscal Year 2022/2023 

Fiscal Year 2023/2024 

Fiscal Year 2024/2025 

Chapter 311 

$533,080 

$547,426 

$574,947 

$591,249 

$821,350 

Chapter 380 

$0 

$0 

$37,387 

$39,172 

$61,013 

Presentation 

The bar chart shows the amount of property taxes rebated in the past five fiscal years, broken down by agreement type. The horizontal axis shows each of the past five fiscal years and the vertical axis shows the dollar amount rebated. For each fiscal year there is vertical column, comprised of two stacked columns, each of which representing the different agreement types. 

City of Amarillo: Number of Tax Abatements Granted Per Year 

Overview 

The chart shows the number of businesses that received a tax abatement from the City of Amarillo in the past five fiscal years. The 2020/21 and 2021/22 fiscal years each had four active abatements, 2022/23 had five, and 2023/24 and 2024/25 each had seven. 

Values 

Numerical values presented on the image: 


Fiscal Year 2020/2021 

Fiscal Year 2021/2022 

Fiscal Year 2022/2023 

Fiscal Year 2023/2024 

Fiscal Year 2024/2025 

Active Abatements Per Year 

4 

4 

5 

7 

7 

Presentation 

The bar chart shows the number of businesses that received a tax abatement from the City of Amarillo in the past five fiscal years. The horizontal axis shows each of the past five fiscal years and the vertical axis shows the number of active abatements each year. Each year has one column, with the height indicating number of active abatements in that year.

Amount of Taxes Abated Per Year 

Overview 

The chart shows the dollar amounts abated over the past five fiscal years from Chapter 312 tax abatement agreements. Each fiscal year shows a larger dollar amount abated, with minor growth over the first three years, a higher increase in the fourth year, and minor growth again in the fifth year. 

Values 

Numerical values presented on the image: 


Fiscal Year 2020/2021 

Fiscal Year 2021/2022 

Fiscal Year 2022/2023 

Fiscal Year 2023/2024 

Fiscal Year 2024/2025 

Taxes Abated by City of Amarillo 

$510,061 

$623,017 

$679,849 

$965,261 

$1,143,899 

Total Abated by All Entities Including City of Amarillo 

$1,569,512 

$1,926,332 

$2,103,099 

$2,884,936 

$2,959,496 

Presentation 

The bar chart represents the amount of taxes abated over the past five fiscal years. The horizontal axis shows each of the past five fiscal years and the vertical axis shows the dollar amount abated. The bar representing taxes abated by the City of Amarillo is sightly offset to the side of the bar representing the amount abated by all participating tax entities for each fiscal year. This shows that the amount abated by the City of Amarillo is a part of the total amount abated by all entities.

City of Amarillo: Taxes Rebated Per Year by Type 

Overview 

This chart shows the dollar amounts rebated by the City of Amarillo from economic development incentive agreements over the past five fiscal years. Each year is broken down by rebate type, including property tax rebates, hotel occupancy tax rebates, and sales tax rebates. Each fiscal year shows a slight increase in total dollars rebated, with a more drastic increase in the most recent fiscal year. 

Values 

Numerical values presented on the image: 


Fiscal Year 2020/2021 

Fiscal Year 2021/2022 

Fiscal Year 2022/2023 

Fiscal Year 2023/2024 

Fiscal Year 2024/2025 

Property Tax Rebates 

$533,080 

$547,426 

$612,334 

$630,421 

$882,363 

Hotel Occupancy Tax Rebates 

$686,747 

$753,112 

$794,828 

$871,423 

$808,348 

Sales Tax Rebates 

$0 

$21,046 

$55,528 

$45,881 

$368,716 


Presentation 

The bar chart represents the amount rebated by the City of Amarillo for each type of tax rebate over the past five fiscal years. The horizontal axis shows each of the past five fiscal years and the vertical axis shows the dollar amount rebated. The different rebate types are stacked vertically in each fiscal year, with the height representing the total dollar amount rebated.